After a flu that kept on lighter versions of the workouts and even out (as I just needed to rest) since last Friday. I am back into training mode, and even biked this morning.
Ehhhhhh

Wednesday, January 28, 2009
Wednesday, January 21, 2009
Triathlon Quote of the Day
"Fitness growth results not from the quantity of exercise, but rather from the capacities of the mind and the body for restoration. The athlete who recovers the fastest is able to complete the most high-quality workouts. Quick recovery from fatigue is key. To those who master this concept, who moderate motivation with patience, and who balance intensity with intelligence, go the medals."
Joe Freil
Heart Rate Monitor Training for Triathletes Part II
[Comment from Mauricio Segura: I found this and now understand much better the "zones" and how they differ from one sport to the other. Read Part I first - I posted that first so it appears below this post-. I havent finished reading the articles myself, but they do seem to be what I need.]
Becoming a Better Animal: How to Effectively Use Your Heart Rate Monitor.
Welcome back! Hopefully the information from Part I was a good overview of the possibilities and limitations of using your heart rate monitor (HRM) and I also hope you had a good sweat while collecting those maximums for cycling and running. Here in Part II, we’ll put those numbers to use by presenting a couple options to use your HRM in workouts.
Many a manly man can tell by looking (while grunting) at their garage walls that no single tool is ever a complete solution, and your HRM is no exception. Now that you’ve dropped a thousand drachmas on your new monitor to help tell you everything your ticker is doing during your bike ride, I’m here to tell you that there’s an even more overall effective and low-rent tool available—your own body.
While you may not be able to pinpoint your exact heart rate at any given time during a workout without using a monitor, knowing those triple digits is not the goal of your training sessions and races—it’s your overall intensity that’s important. On Race Day, intensity correlates to speed over distance, which correlates to a finishing time. Training sessions also have a goal of time and/or distance and intensity. So far, no Olympic medals are given to the athlete who crosses the line with the lowest heart rate.

Planning workouts around these percentages is quite easy to apply. Let’s put a name to some common workout ranges and then assign values:
 Your workouts could be planned using these ranges as:
Steady State: many training publications lately are recommending to not spend much time in this zone. It has been recommended to either drop back to the easier zones or move up. In the past I haven’t tried to avoid this area, so I can’t yet advise to follow this information. My personal training in the next year is aimed at experimenting with this to find out.
Dr. Borg devised scales to capture things like pain, taste, brightness, noise, and even moods. You have probably already seen one of his scales hanging up at the gym—the Rating of Perceived Exertion (RPE). The RPE scale was intended to subjectively put a concrete value to the amount of workload people experienced during physical exertion.
Below in Chart 2 is Borg’s Modified RPE chart showing exertion rates. The chart is numbered from 0 to 10 (with a peak category called “*” or off the chart). Borg wrote simple descriptions for each level ranging from complete rest at 0 to maximal possible exertion at “*”

Applying The Heart Rate Numbers--Your Personal RPE Chart
To fill in the chart, you’ll see that 0 indicates total rest—here you can enter your resting heart rate (RHR). At level “*” (or off the chart), enter your cycling and running maximum heart rates (MHR). In addition to Borg’s descriptions, I’ve added some more that should help.

Myth: The Fat Burning Range
Becoming a Better Animal: How to Effectively Use Your Heart Rate Monitor.
Welcome back! Hopefully the information from Part I was a good overview of the possibilities and limitations of using your heart rate monitor (HRM) and I also hope you had a good sweat while collecting those maximums for cycling and running. Here in Part II, we’ll put those numbers to use by presenting a couple options to use your HRM in workouts.
Before We Talk Numbers…
Many a manly man can tell by looking (while grunting) at their garage walls that no single tool is ever a complete solution, and your HRM is no exception. Now that you’ve dropped a thousand drachmas on your new monitor to help tell you everything your ticker is doing during your bike ride, I’m here to tell you that there’s an even more overall effective and low-rent tool available—your own body.

While you may not be able to pinpoint your exact heart rate at any given time during a workout without using a monitor, knowing those triple digits is not the goal of your training sessions and races—it’s your overall intensity that’s important. On Race Day, intensity correlates to speed over distance, which correlates to a finishing time. Training sessions also have a goal of time and/or distance and intensity. So far, no Olympic medals are given to the athlete who crosses the line with the lowest heart rate.
What we athletes are really looking for when using our HRMs is a simple number on a watch to give us a complete look under the hood at our body’s intensity. What you will find in practice is that sometimes you will get an accurate intensity picture by looking at the readout and sometimes you can be fooled.
During a constant pace run, many factors such as fitness level, weather, hydration, fatigue, soreness, time on the course, and stress all affect your heart rate even if you’re working at the same intensity on the same course as last week or last year. Simply dialing in to a heart rate value during a training session or race can lead to under performing or early exhaustion just as easily as it can guide you to the correct pace to maintain. However, if you know your body well enough, your HRM is still a very useful instrument on your dashboard.
I’ll present 2 methods of using heart rate data for your workouts. The first and simplest is using the percentage chart we created in Part I. This chart is easy to follow but has some drawbacks in terms of accuracy. The second method is using the HRM along with perceived exertion, or your own awareness of how intensely you are working. Using perceived exertion takes some time to become aware of, but is more accurate in accounting for the realities of workouts such as changes in fitness, weather, hydration, stress, etc.
Whichever method you choose to use in practice, your goal for using the monitor should be to become more aware of what your body is doing-- heart rate is only one indicator of your body’s intensity. During all workouts you should try to become keenly aware of how hard you’re working and use heart rate as backup—not the other way around.
Method One: By The Numbers
The easiest method of using your HRM for workouts is to simply follow the numbers. Let’s revisit the chart created back in Part I. Chart I shows an example using my current heart rates based on the Karvonen formula.
Chart 1: Heart rate chart based on Sport-specific Maximums and Resting Heart Rate
Planning workouts around these percentages is quite easy to apply. Let’s put a name to some common workout ranges and then assign values:
Your workouts could be planned using these ranges as: Long Slow: used for recovery, most runs off the bike, long easy workouts in the off season.
Endurance: the bulk of your runs and rides. You’ll still produce a sweat, but should be able to talk most of the time.
Steady State: many training publications lately are recommending to not spend much time in this zone. It has been recommended to either drop back to the easier zones or move up. In the past I haven’t tried to avoid this area, so I can’t yet advise to follow this information. My personal training in the next year is aimed at experimenting with this to find out.
Tempo/Threshold: fast work that you can hold for some number of minutes. Similar to an average (not max!) pace you can hold for a 10k length race. Typical workouts in this zone include tempo work with a slow warm up and warm down and a 15-30 minute effort in the middle at this high pace.
Interval: short bouts of 1-5 minutes at high pace, similar to end of 5k race. These workouts may be performed but are not the staple of basic endurance training.
Sprint: All out efforts usually saved for races. This pace can only be held for less than a couple minutes at most.
In general, the bulk of your workouts will be geared around Endurance and Tempo/Threshold. Higher intensities are also used for swimming since recovery time is quite short. Planning a week or even an entire season becomes more complex since each individual has a different goal set and also different strengths and weaknesses. Whether you work with a coach or find training plans on the net or in books, you can easily translate these effort levels into the plan descriptions.
While planning simplicity is an advantage, one major drawback to using this chart is a change in fitness levels. Starting out as an endurance athlete or even starting out the new season, fitness levels are probably not going to be at a peak. If you set out to do an easy long run at 70% by following the monitor, this pace might be just fine when beginning as an endurance athlete or even beginning a new season as an experienced athlete. However, 9 months later when fitness has improved considerably the pace might be much too slow even at 70%. This drawback of following fixed percentages leads us to Method Two….
Method Two: Gettin’ in Touch With Your Feelings
Long before endurance athletes were sitting around a pint bragging about their HRM graphs of everything from snogging to running up Pike’s Peak, a Swede named Dr. Gunnar Borg was publishing research on measuring the physical and mental sensations that people experience.
Dr. Borg devised scales to capture things like pain, taste, brightness, noise, and even moods. You have probably already seen one of his scales hanging up at the gym—the Rating of Perceived Exertion (RPE). The RPE scale was intended to subjectively put a concrete value to the amount of workload people experienced during physical exertion.
Below in Chart 2 is Borg’s Modified RPE chart showing exertion rates. The chart is numbered from 0 to 10 (with a peak category called “*” or off the chart). Borg wrote simple descriptions for each level ranging from complete rest at 0 to maximal possible exertion at “*”
The original RPE scale is numbered from 6 to 20, with 6 being complete rest and 20 representing complete exhaustion. The reason for this odd numbering is that the subjects of Borg’s exertion study were all fit individuals who had heart rates that roughly corresponded to 60 at rest and a maximum for his tests of around 200. Borg later created the Modified RPE scale that is numbered with a more convenient 0 to 10 range. We’ll use this one. I’ve put both together here in the same listing in case you are already familiar with using the original RPE values. (1)
Chart 2: Borg’s RPE and Modified RPE Chart

Applying The Heart Rate Numbers--Your Personal RPE Chart
Also from your data in Part I, we can now begin to match some hard numbers with these RPE levels. Just as your resting and maximal values are unique to you, your chart data will be as well. I’ve created a couple RPE charts here that you can print out to use.
Chart 3 is a full page with RPE values and places to enter your current personal heart rate data. At the end of this article, I’ve also included a Chart 4 below which is a much smaller version that you can tape onto your bike stem or tape to back of your mp3 player to take along during workouts.
To fill in the chart, you’ll see that 0 indicates total rest—here you can enter your resting heart rate (RHR). At level “*” (or off the chart), enter your cycling and running maximum heart rates (MHR). In addition to Borg’s descriptions, I’ve added some more that should help.
Chart 3: Matching Heart Rates with Borg’s Modified RPE scale


Now comes the hard part—filling in the middle of the chart. The easiest way to do this is practice. Wear your monitor on bike rides and runs of all different intensities and get a feel for how hard you’re working and try to make an honest assessment placing an level number to that effort. While it would be much easier to calculate a fixed number but the values wouldn’t be accurate. Also, most of the values for expending effort take up most of the range of the chart so drawing a line between resting and maximal will not give accurate numbers.(2) The reason is that there are only a couple levels to describe everything from complete rest to fast walking is that most of us don’t have much of an interest in distinguishing effort levels from just watching TV to dialing the pizza guy while watching TV (although I’m sure the calorie burning does add up after enough dialing.)
So why isn’t there a formula to fill in the chart and why use it instead of the simple chart from Part I? Matching effort level to heart rate is very closely linked to your fitness level at a specific time in each sport . For example, in January, running at what feels like a moderate pace (Level 3) might show as 150. In June, that same moderate feeling run may only show as 140 due to many factors such as increased fitness and warmer temperatures, or even negative factors such as overtraining or illness. If you had stuck to running January’s 150 level for your run, you’d be going too hard for your moderately scheduled workout.
A good way to practice using the chart is to spend some workout time playing a game of Heart Rate Jeopardy: “I am working fairly strong.”….”What is 155?” It sounds cheesy (and it is) but you’ll be surprised after a few weeks of how close you can come to the actual reading. Also take your HRM to races and see how good you are at guessing. Race stress and increased pace from your normal training sessions might keep you out of the Final Jeopardy round for a while until you become more tuned in to your body, but practice, practice, practice. A final note about race heart rates…you might not be able to use your normal training values on race day due to increased stress and adrenalin. Using your training rates in a race situation can leave you going at a lower pace than your body is capable of for a given intensity due to “race stress.” Again, know your own body—if you don’t feel any stress and it feels like a calm day on the course you can trust the monitor a little more than if you’ve got cyclists zooming all around you with friends and family cheering roadside.
Chart 4: Compact RPE/Heart Rate Chart
(print one each for the bike and run)
Myth: The Fat Burning Range
Back in Part I, I presented a few myths regarding heart-rate monitors and heart rate based training. Now before departing, there’s one more that I’d like to talk about: fat burning range. In quite a few magazines and web sites I’ve seen articles that show where working out at a lower intensity will burn more fat thus leading to an even slimmer, trimmer you. While burning more calories will get you into those smaller jeans, doing so by working out at a lower intensity is not the fastest way. In order to lose weight, you need to create a calorie deficit—it doesn’t matter where that deficit comes from.
It is true that while performing aerobic exercise that at the lower end of the aerobic zone (about Level 3 on the Modified RPE chart) that the body does burn a higher percentage of fat than carbohydrate and that at higher intensities (Level 8) the body burns a higher percentage of carbohydrate than fat as fuel.(3)
Notice that I said percentages and not total calories. A Level 8 workout for 30 minutes is going to burn far more calories than at Level 3. Let’s look at an example of a 150lb person running at Level 3 (ex: 12min pace) and also running at Level 8 (7.5min pace):
Level 3 run for 30 minutes: burn 55% fat, 45% carbohydrate, 288 total calories
Level 8 run for 30 minutes: burn 10% fat, 90% carbohydrate, 460 total calories
Even though the Level 8 workout may have burned less overall calories from fat, the overall number of calories is much higher. More total calories burned = Smaller Jeans.
Final Note: Cardiac Drift
Now that you have a good overview of RPE and using your monitor in workouts, I’d like to another point that can cause some discrepancies between effort level and heart rate. During long workouts of usually more than 1 hour, the heart has a tendency to beat slightly faster even though you do not feel as if you are working any harder—this is called cardiac drift, or cardiac creep. The heart rate increases even for the same effort expended because as you sweat, your blood volume decreases due to fluid loss and also your heart tries to do its part in regulating body temperature. The good thing for you is that in most cases you might not need to slow down as the heart rate creeps up. As long as your major muscle groups aren’t being affected and you don’t feel more laboured, there’s no reason to strictly obey your HRM. Common sense should prevail in extreme conditions of heat, cold and dehydration though. If you’re training or racing and your HRM is showing elevated (or depressed in the case of cold temps) values, do a self assessment to see if you really should follow the numbers or if common sense tells you to slow down. Again, the point of this entire article is to show that the HRM is a useful tool, but that it doesn’t tell you everything you need to know.
Thanks for reading and feel free to drop me a mail if you have questions or have had some interesting results using your monitor.
Heart Rate Monitor Training for Triathletes Part I
Becoming a Better Animal: How to Effectively Use Your Heart Rate Monitor.
So you’ve just finished running 40 blissful minutes. Still dripping sweat, you slog through the house towards the den while removing your brand new heart rate monitor chest strap. After downloading the workout data to your PC, you find out that you averaged 155 beats a minute. You then print out a pretty 4-color graph capturing each beat of your trail escapade to hang proudly on the fridge, edging out space from your first-grade daughter’s 64-color masterpieces. Your new toy has performed flawlessly, you now know what your heart did minute by minute, and your spouse has visual proof that it does indeed do everything the brochure said, thus justifying your lobbying efforts. Now what?
Hopefully your heart rate monitor purchase was intended for improving your athletic performance and not solely to compete with a five year old’s Louvre ambitions. In a 2-part series, I’ll cover how to use a heart rate monitor to help you train and race more effectively, what information it can’t tell you, and some common myths about heart rate-based training.
Here in Part I, I'll explain how to determine training zones with a heart rate monitor and show how using the monitor is unique to your own physiology and sports you compete in. After we setup training zones, Part II will explain how to put this information to use in training and racing, and also explain some pitfalls and cautions in using the monitor.
To use the monitor effectively, you need to know how hard your heart is working relative to your body’s capacity for the activity you are doing. Some training days are going to be easy, others will be harder efforts, and the monitor can help you stay within range of effort for a particular workout.
The single best outcome from using your heart rate monitor is to ensure your easy days are easy and your hard days are hard. This sounds almost too simplistic to even mention, but habits dominate almost every aspect of our lives, including being an athlete. “Just going out for a ride” tends to result, by sheer habit, in cycling at nearly the same effort whether it’s 60 minutes or 4 hours. Your body improves most by cycles of stress and recovery, and using your monitor correctly will help keep each workout on target, whether it is lung-busting intervals, or an easy recovery ride.
So how do you know if you’re working at the correct effort by watching your heart rate? If you know how fast you’re your heart is capable of beating while cycling (a maximum) and you know what your heart rate is at complete rest (a minimum) you can find zones in between which give you a decent picture of how hard you are working within a given ride.
Before describing how to determine these zones for your workouts, I want to cover a couple very common myths regarding heart rates and training zones. Let’s use an example… Your cycling friend Urs is telling you about his ride last night and he says he did a solid aerobic cycling session workout at 70% of his maximum, which he said was a 150 bpm average. You ask yourself, is 70% good? Should I maintain 150bpm for an aerobic session? Should I also maintain 150 bpm for running? How did he know his maximum heart rate to begin with?
Myth: You have a single maximum heart rate number that can be applied to all activities. When people talk about their Maximum Heart Rate (MHR) what they really mean, whether they know it or not, is that MHR really only applies to the type of activity you are performing and it is not an absolute maximum. Your heart can easily beat 300 times a minute if your brain tells it to do so, but you will hopefully never see this out on a run or bike session. When we talk about MHR, we always mean activity specific. You may find out your MHR for running is 190 bpm but on the bike it may be only be 175. The amount and type of muscle fibers recruited and the amount oxygen needed by the muscle groups contribute your brain’s decision making on how fast the heart needs to pump. While you may use leg muscles for both running and cycling, the bike supports most of your body weight and overall recruits less muscle activity than running, resulting in most people having a lower MHR for cycling than running.
Myth: You can use a formula to find your maximum heart rate. As we've seen above, your MHR is different for every activity you perform. In addition, it's also difficult to predict a number within each sport with formulas such as the popular MHR = 220 –age or the newer MHR = 205 -.1/2 age. The fact is that even if the formulas would be based on a single activity, there are wide genetic differences between individuals that make these formulas too vague to be predictably useful.
As an example, my actual MHR for running is 4 beats less than what the 220 - age formula indicates, but my cycling MHR is 13 beats less. If I used the formula's value to determine my training zones, then my "easy" heart rate for a long bike isn't so easy anymore. Performance testing, not using a formula, is the only really accurate way to find your MHR.
We now know that maximum heart rates are very unique to both individual and activity, and it’s easy to see why Urs’ workout targets may not be applicable to you at all. We will now also see how more accurate training zones can be calculated instead of just simply measuring percentages of our MHR.
Data Collection--Your Personal Physiology
In order to set up effective training zones, we need to know a few pieces of information very personal to you: your Resting Heart Rate (RHR) and for each sport, a Maximum Heart Rate (MHR). Note: While I use a monitor for cycling and running, I don’t use one for swimming. I’ve found it often difficult to get a good reading in the pool and for training, you only typically get to see the monitor value while stopped at the wall. While doing start and stop of intervals the heart rate will lag behind the actual effort your are performing at thus giving often false feedback to you. In the pool, I instead use the clock and perceived exertion to determine how hard I am working. Now, let's start measuring! Calculating Maximum Heart Rate (MHR)The test to find your maximums for running and cycling are going to hurt! There's no other way to do it. In fact, the harder you work the more accurate the measure is. The MHR test for running and cycling both consist of the same protocol except one is performed on the bike and the other is done while running. Before completing these maximal tests on your own, please, please, (please!) get a thorough physical and a doctor’s clearance. The level of exertion is significantly higher than just going out for a healthy jog around the block. Even better would be to do the test for the first time at a medical center where health professionals can do a complete physical, blood work up, and the performance test (at least for running) all together. Check your local hospital or university athletic department for a contact for these centers.
The test consists of a short warm up, a gradual increase of intensity over time, a final push to get a maximum, then a complete cool down. The reason for the gradual build up is that brain doesn't signal the heart to work at its true maximum for that activity instantaneously. So if you warm up for 5 minutes, then sprint your hardest for another minute, the heart still will not have achieved a true maximum for that activity. Slow, steady increases are needed to coax the heart to a true maximum.
Here is the actual test which works well for both running and cycling:
5 min. warm up slowly to a pace at the end where you are beginning to breathe a little hard
5 min. maintain the pace, increasing a bit at the end
5 min. increase pace again to labored breathing.
5 min. on a gradual incline increase the pace from just breathing hard tobreathing very hard. Transition directly into…
2 min. all out sprint on a steep hill to maximum speed!
1 min. push this max speed while still going up and hold for a minute oras long as possible!! Record MHR.
10 min. cool down at a very easy pace and stretch.
------------------
33 min. total ( 18 minutes hard, 15 minutes warm up/down)
Why include the hill climbing in addition to already killing yourself? I found quite by accident that I could push a higher heart rate climbing hills than standard flat running tests. I had an treadmill test performed in a laboratory and another sprinting test around a track and both had registered a running MHR of 179. A couple years later after moving here to Switzerland I did basically the same test time with the final minutes on a very steep incline and recorded a new MHR of 184. I felt the same level of complete exhaustion in all tests, but with a new high value.
If you happen to have nothing resembling an incline in your area, you can do the same test on flat ground, but keep in mind that it will probably not be a true maximum for the activity, but a "level ground maximum."
I used to do a MHR test about twice a year, but now that I think I’ve determined an accurate max, I only do it once a year. Your MHR for each activity does not change with fitness level but may however, decline slightly with advancing age.
Calculating Resting Heart Rate (RHR)
Compared with the previous test, RHR is pure joy to measure! At a point of complete rest, simply take your pulse for 15 seconds, multiply by 4 and record. The best time to measure this is first thing in the morning while well rested and not in an overall overtrained state. Another option is to wear your monitor overnight and look at the average. I've found both to come out to be about the same number. One caveat is that if you really have to pee first thing in the morning this can raise your RHR or if the alarm clock scared the bejeezus out you, turn off the alarm and/or use the toilet, return to bed for another 5-10 minutes and then record.
Some coaches recommend taking this measure for 3 consecutive mornings and calculate an average. For me, I haven't found much difference day to day as long as I'm about at the same fatigue level and I am getting the same amount of sleep.
Unlike MHR, your resting heart rate does fluctuate with your fitness level. Over the long term, people typically have a decline in RHR as their fitness level improves, although genetics does play a part. I can train to my wits end but I will never attain 5-time Tour de France champion Miguel Indurain's RHR of 28. Your RHR also will change with your body’s fatigue level, so taking your morning pulse often can indicate overtraining/illness if you notice a rise of more than a few beats, especially if higher readings last more than a few days.
Working Range
Why do we need to measure resting heart rate to calculate training zones? It would be simpler to just find a maximum heart rate and base the training on percentages from that maximum. But just as everyone has a unique MHR for each activity, each person also has a unique RHR. To ensure your basic survival, your heart rate never goes down to zero, so think of the area between your resting and maximum heart rates as your available working range for each activity. We'll base your training percentages from this range instead.
Calculating Training Zones
The Karvonen formula takes advantage of the difference between your MHR and RHR and is what we will use to derive our training zones based on your personal measurements:
Heart Rate % of Usable Maximum = ((MHR – RHR) * P ) + RHR
where P is the desired percentage of maximum (1, .9, .8, .7, etc..)
As an example, I'll use my own personal measured data to calculate percentages from 100% down to 50%.
My Measured Data
RHR = 44
MHR = 186 (running)
MHR = 176 (cycling)
Using the formula for 75% I get: 75% rate = ((186 – 44)*.75) + 44 = 151bpm
Here is the entire chart for my cycling and running:
 So after performing these tests and calculations you have very personalized target percentages for both cycling and running. In the next article, I'll show you how to use these percentages to plan your training, list more myths such as “fat burning range,” show some common pitfalls of HR based training, and introduce some additional (free!) tools which complement your HR monitor to have an even better picture on how your body is performing during your workouts.Until then, see you on the trail!
Scott
Originally posted HERE
So you’ve just finished running 40 blissful minutes. Still dripping sweat, you slog through the house towards the den while removing your brand new heart rate monitor chest strap. After downloading the workout data to your PC, you find out that you averaged 155 beats a minute. You then print out a pretty 4-color graph capturing each beat of your trail escapade to hang proudly on the fridge, edging out space from your first-grade daughter’s 64-color masterpieces. Your new toy has performed flawlessly, you now know what your heart did minute by minute, and your spouse has visual proof that it does indeed do everything the brochure said, thus justifying your lobbying efforts. Now what?
Hopefully your heart rate monitor purchase was intended for improving your athletic performance and not solely to compete with a five year old’s Louvre ambitions. In a 2-part series, I’ll cover how to use a heart rate monitor to help you train and race more effectively, what information it can’t tell you, and some common myths about heart rate-based training.
Here in Part I, I'll explain how to determine training zones with a heart rate monitor and show how using the monitor is unique to your own physiology and sports you compete in. After we setup training zones, Part II will explain how to put this information to use in training and racing, and also explain some pitfalls and cautions in using the monitor.
To use the monitor effectively, you need to know how hard your heart is working relative to your body’s capacity for the activity you are doing. Some training days are going to be easy, others will be harder efforts, and the monitor can help you stay within range of effort for a particular workout.
The single best outcome from using your heart rate monitor is to ensure your easy days are easy and your hard days are hard. This sounds almost too simplistic to even mention, but habits dominate almost every aspect of our lives, including being an athlete. “Just going out for a ride” tends to result, by sheer habit, in cycling at nearly the same effort whether it’s 60 minutes or 4 hours. Your body improves most by cycles of stress and recovery, and using your monitor correctly will help keep each workout on target, whether it is lung-busting intervals, or an easy recovery ride.
So how do you know if you’re working at the correct effort by watching your heart rate? If you know how fast you’re your heart is capable of beating while cycling (a maximum) and you know what your heart rate is at complete rest (a minimum) you can find zones in between which give you a decent picture of how hard you are working within a given ride.
Before describing how to determine these zones for your workouts, I want to cover a couple very common myths regarding heart rates and training zones. Let’s use an example… Your cycling friend Urs is telling you about his ride last night and he says he did a solid aerobic cycling session workout at 70% of his maximum, which he said was a 150 bpm average. You ask yourself, is 70% good? Should I maintain 150bpm for an aerobic session? Should I also maintain 150 bpm for running? How did he know his maximum heart rate to begin with?
Myth: You have a single maximum heart rate number that can be applied to all activities. When people talk about their Maximum Heart Rate (MHR) what they really mean, whether they know it or not, is that MHR really only applies to the type of activity you are performing and it is not an absolute maximum. Your heart can easily beat 300 times a minute if your brain tells it to do so, but you will hopefully never see this out on a run or bike session. When we talk about MHR, we always mean activity specific. You may find out your MHR for running is 190 bpm but on the bike it may be only be 175. The amount and type of muscle fibers recruited and the amount oxygen needed by the muscle groups contribute your brain’s decision making on how fast the heart needs to pump. While you may use leg muscles for both running and cycling, the bike supports most of your body weight and overall recruits less muscle activity than running, resulting in most people having a lower MHR for cycling than running.
Myth: You can use a formula to find your maximum heart rate. As we've seen above, your MHR is different for every activity you perform. In addition, it's also difficult to predict a number within each sport with formulas such as the popular MHR = 220 –age or the newer MHR = 205 -.1/2 age. The fact is that even if the formulas would be based on a single activity, there are wide genetic differences between individuals that make these formulas too vague to be predictably useful.
As an example, my actual MHR for running is 4 beats less than what the 220 - age formula indicates, but my cycling MHR is 13 beats less. If I used the formula's value to determine my training zones, then my "easy" heart rate for a long bike isn't so easy anymore. Performance testing, not using a formula, is the only really accurate way to find your MHR.
We now know that maximum heart rates are very unique to both individual and activity, and it’s easy to see why Urs’ workout targets may not be applicable to you at all. We will now also see how more accurate training zones can be calculated instead of just simply measuring percentages of our MHR.
Data Collection--Your Personal Physiology
In order to set up effective training zones, we need to know a few pieces of information very personal to you: your Resting Heart Rate (RHR) and for each sport, a Maximum Heart Rate (MHR). Note: While I use a monitor for cycling and running, I don’t use one for swimming. I’ve found it often difficult to get a good reading in the pool and for training, you only typically get to see the monitor value while stopped at the wall. While doing start and stop of intervals the heart rate will lag behind the actual effort your are performing at thus giving often false feedback to you. In the pool, I instead use the clock and perceived exertion to determine how hard I am working. Now, let's start measuring! Calculating Maximum Heart Rate (MHR)The test to find your maximums for running and cycling are going to hurt! There's no other way to do it. In fact, the harder you work the more accurate the measure is. The MHR test for running and cycling both consist of the same protocol except one is performed on the bike and the other is done while running. Before completing these maximal tests on your own, please, please, (please!) get a thorough physical and a doctor’s clearance. The level of exertion is significantly higher than just going out for a healthy jog around the block. Even better would be to do the test for the first time at a medical center where health professionals can do a complete physical, blood work up, and the performance test (at least for running) all together. Check your local hospital or university athletic department for a contact for these centers.
The test consists of a short warm up, a gradual increase of intensity over time, a final push to get a maximum, then a complete cool down. The reason for the gradual build up is that brain doesn't signal the heart to work at its true maximum for that activity instantaneously. So if you warm up for 5 minutes, then sprint your hardest for another minute, the heart still will not have achieved a true maximum for that activity. Slow, steady increases are needed to coax the heart to a true maximum.
Here is the actual test which works well for both running and cycling:
5 min. warm up slowly to a pace at the end where you are beginning to breathe a little hard
5 min. maintain the pace, increasing a bit at the end
5 min. increase pace again to labored breathing.
5 min. on a gradual incline increase the pace from just breathing hard tobreathing very hard. Transition directly into…
2 min. all out sprint on a steep hill to maximum speed!
1 min. push this max speed while still going up and hold for a minute oras long as possible!! Record MHR.
10 min. cool down at a very easy pace and stretch.
------------------
33 min. total ( 18 minutes hard, 15 minutes warm up/down)
Why include the hill climbing in addition to already killing yourself? I found quite by accident that I could push a higher heart rate climbing hills than standard flat running tests. I had an treadmill test performed in a laboratory and another sprinting test around a track and both had registered a running MHR of 179. A couple years later after moving here to Switzerland I did basically the same test time with the final minutes on a very steep incline and recorded a new MHR of 184. I felt the same level of complete exhaustion in all tests, but with a new high value.
If you happen to have nothing resembling an incline in your area, you can do the same test on flat ground, but keep in mind that it will probably not be a true maximum for the activity, but a "level ground maximum."
I used to do a MHR test about twice a year, but now that I think I’ve determined an accurate max, I only do it once a year. Your MHR for each activity does not change with fitness level but may however, decline slightly with advancing age.
Calculating Resting Heart Rate (RHR)
Compared with the previous test, RHR is pure joy to measure! At a point of complete rest, simply take your pulse for 15 seconds, multiply by 4 and record. The best time to measure this is first thing in the morning while well rested and not in an overall overtrained state. Another option is to wear your monitor overnight and look at the average. I've found both to come out to be about the same number. One caveat is that if you really have to pee first thing in the morning this can raise your RHR or if the alarm clock scared the bejeezus out you, turn off the alarm and/or use the toilet, return to bed for another 5-10 minutes and then record.
Some coaches recommend taking this measure for 3 consecutive mornings and calculate an average. For me, I haven't found much difference day to day as long as I'm about at the same fatigue level and I am getting the same amount of sleep.
Unlike MHR, your resting heart rate does fluctuate with your fitness level. Over the long term, people typically have a decline in RHR as their fitness level improves, although genetics does play a part. I can train to my wits end but I will never attain 5-time Tour de France champion Miguel Indurain's RHR of 28. Your RHR also will change with your body’s fatigue level, so taking your morning pulse often can indicate overtraining/illness if you notice a rise of more than a few beats, especially if higher readings last more than a few days.
Working Range
Why do we need to measure resting heart rate to calculate training zones? It would be simpler to just find a maximum heart rate and base the training on percentages from that maximum. But just as everyone has a unique MHR for each activity, each person also has a unique RHR. To ensure your basic survival, your heart rate never goes down to zero, so think of the area between your resting and maximum heart rates as your available working range for each activity. We'll base your training percentages from this range instead.
Calculating Training Zones
The Karvonen formula takes advantage of the difference between your MHR and RHR and is what we will use to derive our training zones based on your personal measurements:
Heart Rate % of Usable Maximum = ((MHR – RHR) * P ) + RHR
where P is the desired percentage of maximum (1, .9, .8, .7, etc..)
As an example, I'll use my own personal measured data to calculate percentages from 100% down to 50%.
My Measured Data
RHR = 44
MHR = 186 (running)
MHR = 176 (cycling)
Using the formula for 75% I get: 75% rate = ((186 – 44)*.75) + 44 = 151bpm
Here is the entire chart for my cycling and running:
So after performing these tests and calculations you have very personalized target percentages for both cycling and running. In the next article, I'll show you how to use these percentages to plan your training, list more myths such as “fat burning range,” show some common pitfalls of HR based training, and introduce some additional (free!) tools which complement your HR monitor to have an even better picture on how your body is performing during your workouts.Until then, see you on the trail!Scott
Originally posted HERE
Tuesday, January 20, 2009


Friday, January 16, 2009
IM Training weeks 1 - 6 [of 33] Feedback
The workouts so far seem excellent.
Frequency - OK.
Duration – Some morning workouts extend for one hour and half even longer, I would prefer them to be one hour and half max including warm-up, stretches, and cool-down.
Intensity – I have found it a little hard to bring up my heart rate to the max specified specially for the bike; on the contrary, keeping below max specified is hard in the run
Latest Readings suggested by my Coach Henry 1 - on the importance of Sleep and 2 - another reading not only by Scott Tintly [You are what you eat]
Thursday, January 15, 2009
Fartleks vs Intervals
Just learn from some joshm367 who posted in HERE back in 2004 a few of the differences between Fartleks and intervals.
- Fartleks are based on time and can be done on roads or track.
- Intervals are based on distance and usually done on the track or marked course.
- Fartleks are continuous running and intervals usually have breaks.
- Intervals on the track gives you specific times to compare to the past. It also usually lets you run faster given the track surface and breaks in between intervals.
Book Recommedation - Total Immersion
An an amozon customer puts it his review, "...If you want to learn efficient, relaxed, fish-like swimming, using the least number of heart beats and strokes, this is the book."


Tuesday, January 13, 2009
What is IWSPA or IwantSixPackAbs?
It is a sixteen-week program based on three equally important fundamentals:
 I have fun just helping people out, telling them about my very own experience or answering their questions.
If you have questions about IWSPA, just leave me a comment, and I will comment back or e-mail you (if you so specify) with my thoughts.
- diet,
- strength training, and
- high intensity interval training (HIIT).
I wont explain it, as it is explained in Arnel's site http://www.iwantsixpackabs.com/
I was in contest Arnel opened up in Sept 2007 ending in Dec 2007. I won second place!!! I was absolutely happy with the results. Luis Velez with whom I lost contact made it for first place and Abs Man of the year 2007. Unfortunately, Luis stopped updating his Blog.
... in progress...
The picture below corresponds to Dec 2007 (taken in Punta Leona -Pacific coast of Costa Rica -by Ricardo Alvarado) as I was half way through the IWSPA at about 11% BF. I I have been focusing on Triathlon lately and was putting on some more muscle right after IWSPA and before a focus on Tri thus losing a tiny bit of definition -currently around 13-14% BF, which I am regaining little by little with the Ironman training. I will go through the 16-week program again starting on Aug 24 2009 as my Triathlon Coach said it would be ok at the end of our 33-week Ironman Macrocycle I.
 I have fun just helping people out, telling them about my very own experience or answering their questions.
If you have questions about IWSPA, just leave me a comment, and I will comment back or e-mail you (if you so specify) with my thoughts.
Monday, January 12, 2009
Triathlon Checklist
Here is Triathlon checklist, you can find clicking HERE. I am about to tailor my own and will share it as soon as I have it ready. I am planning on coming with checklists for T1, T2, Swim WO, Bike WO, Run WO.


Triathlon Book Recommendation
I think this is by far the best I have come accross!!!
As an Amazon customer puts it in his review, "Joe Friel's latest training book is possibly one of the most encompassing books about triathlon training out there. It covers nearly ever aspect of the sport. While some people may disagree with some elements of Friel's training schedules, there is little doubt that they are solidly based. It is extremely easy for a reader to make their own schedule from this book. It makes the process simple and easy to understand. This book is a must for any triathlete who wishes to either know more about training, or who wants to set up their own schedule for periodization triathlon training."
 Get the book from Amazon HERE
Friday, January 9, 2009
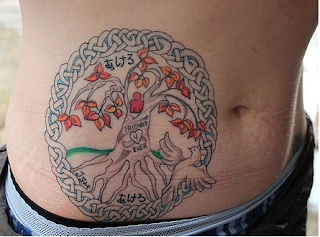
IM tattoos/ Ironman Tattoo Designs - I
I have tattoos in the arms. I have googled for IM and half IM tattoo designs all over.
It is hard to come accross them. I did find really cool ones in different places.
Here they are....
For more IM tattoos/ Ironman Tattoo Designs, see my entries for August 21, 2009 and February 14, 2011


 For more IM tattoos/ Ironman Tattoo Designs, see my entries for August 21, 2009 and February 14, 2011
It is hard to come accross them. I did find really cool ones in different places.
Here they are....
For more IM tattoos/ Ironman Tattoo Designs, see my entries for August 21, 2009 and February 14, 2011


Images contained within this site, with the exception of those represented to be originally produced by me, are believed to be in the public domain. They have been obtained either from public domain libraries on the Internet. I do not sell or license any of these collected images and claim no individual copyright to them. They are gathered and made available here solely as a free public service to the Internet Community.
Subscribe to:
Posts (Atom)